 |
|||
|
|
|||
|
Page Title:
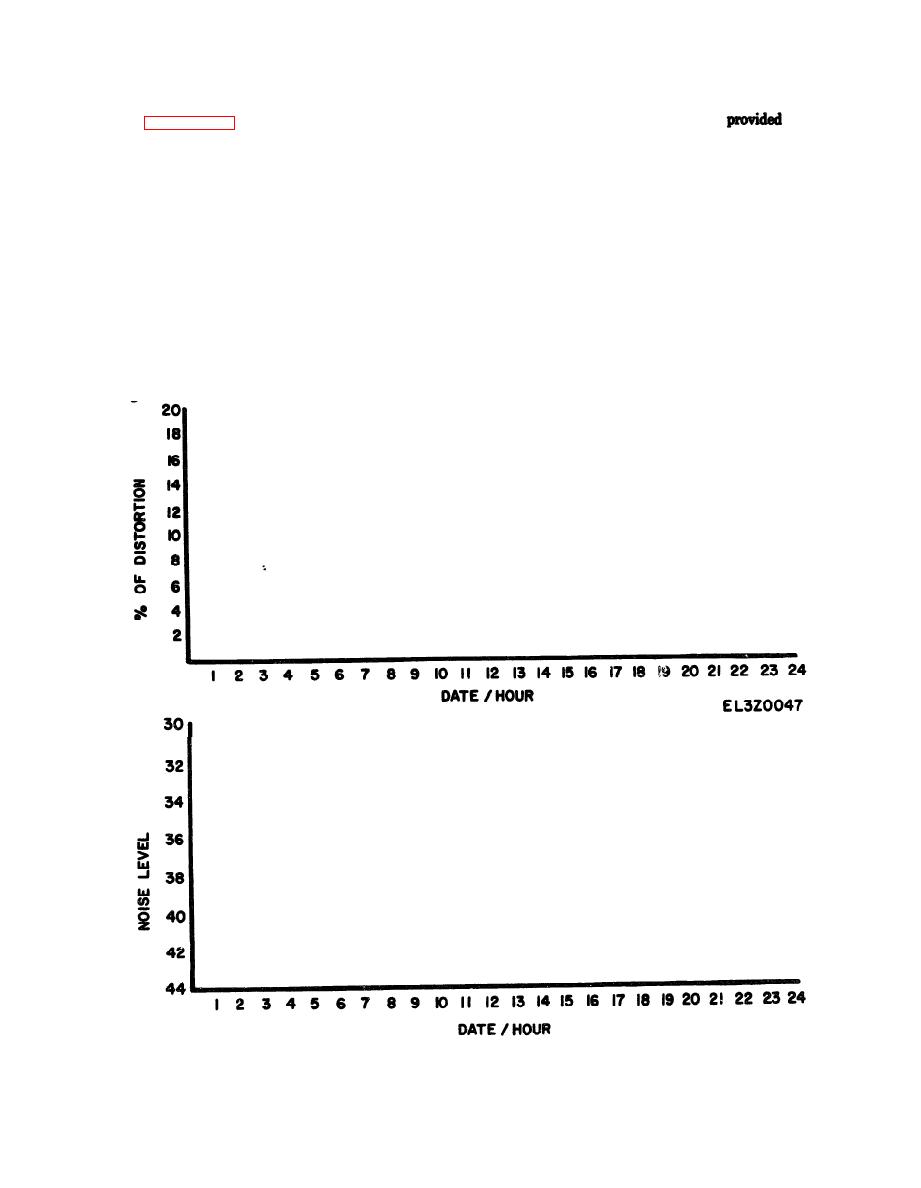
Figure 4-12. Sample noise level trend analysis chart. |
|
||
| ||||||||||
|
|
 TM 11-5895-1012-10
the user until proper signal levels are
e. Figure 4-11 through 4-13 are examples of
by the
user. Actions of this nature will be properly docu-
typical graphs that may be used for trend analysis.
mented and immediately reported to the appropriate
Docc and operation and maintenance activities.
Denial of service for this reason should be done
Frequently, excessive signal levels are introduced into
judiciously and then only with approval of the
the DCS from the user equipment. Excessive signal levels
Technical Control Facility shift supervisor. As a rule
from just a small number of users can cause crosstalk
of thumb, the following criteria may be applied:
across the baseboard of an entire system. Whenever
a. If the signal level is within 3 dB of the correct
excessive signal levels are detected, as a result of in-
level, the serving TCF should initiate normal coordina-
service quality control testing or as a result of a user
tion to correct the level.
complaint, immediate action will be initiated by the
b. If the signal level is between 3 dB and 6 dB above
technical controller to locate the source. The serving
the correct level, the user must correct the level within
TCF will immediately notify the violating user, direct
15 minutes or the TCF will deny service.
his attention to the provisions of established direc-
c. If the signal level is more than 6 dB above the cor-
tives, and request that immediate action be taken to
rect level, the TCF will immediately deny service until
correct the deficiency. If the user continues to violate
the user provides the correct level.
signal level limits, the serving TCF will deny service to
EL3Z0048
|
|
Privacy Statement - Press Release - Copyright Information. - Contact Us |
