 |
|||
|
|
|||
|
Page Title:
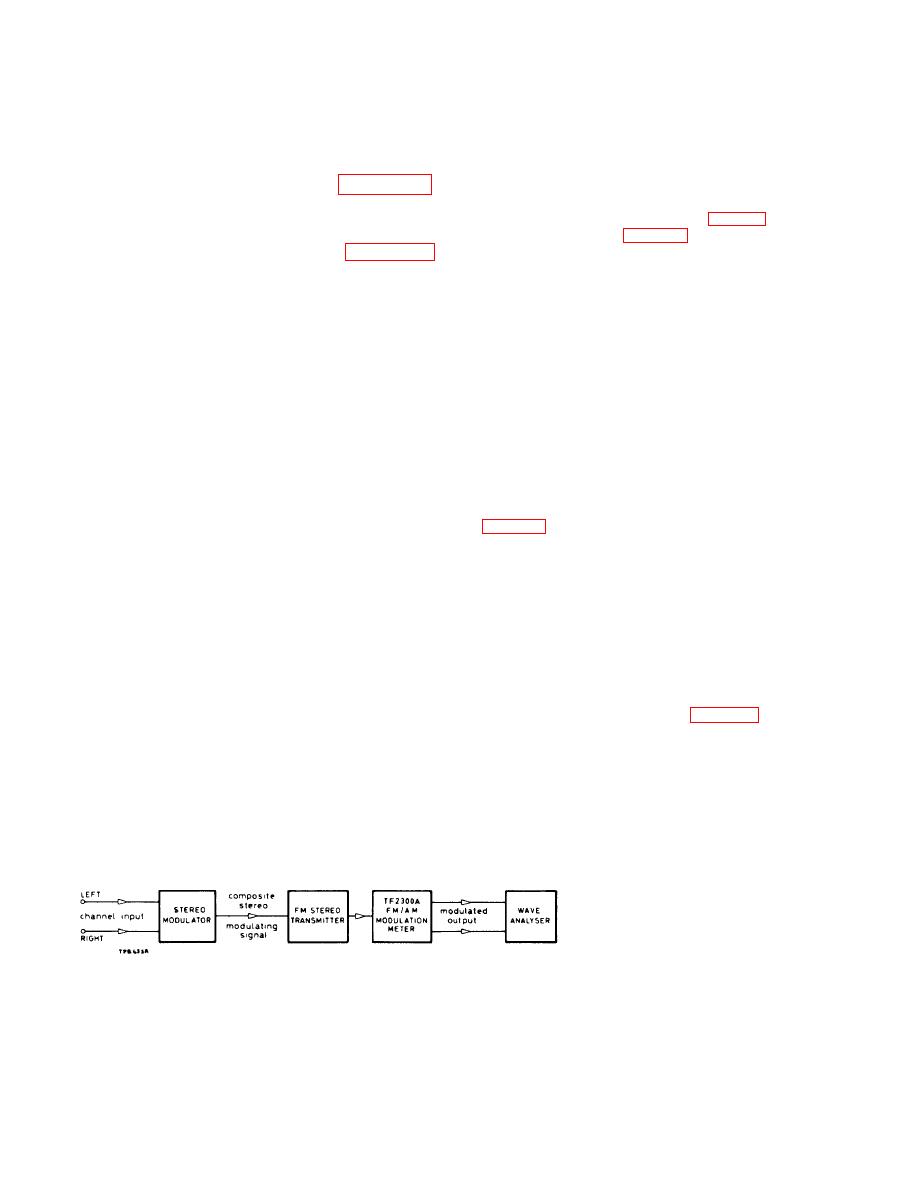
Fig. 2-6. Test arrangement for measuring distortion |
|
||
| ||||||||||
|
|
 TM 11-662 5-3014-14
The test arrangement for measuring distortion in
For practical working purposes, the small
an f.m. stereo transmitter is shown for measurements on
amount of distortion introduced by the modulation meter
the G. E. -Zenith system is given below :-
can be neglected.
(1)
Connect the transmitter output to the mod-
2.16.2 Channel separation
ulation meter in accordance with section 2.4 -
Preparation for Use.
If it were possible to view the 50 Hz to 15 kHz
and the 23 to 53 kHz regions of Fig 2-5 separately, the
(2)
Set up the modulation meter with the trans-
waveforms shown in Figs. 2-7 (a) and (b) would be seen.
mitter signal on, in accordance with section 2.5 -
Measuring F . M. Deviation. The following
The ideal composite modulating signal with the
notes are intended to amplify the setting
19 kHz pilot tone removed should be the sum of these
instructions and refer specifically to the G. E. -
waveforms as shown in (c). In practice, there will be
Zenith System.
amplitude unbalance and relative phase shift (group
delay error) between the two added signals. These two
(3)
Set the controls as follows :-
effects, which can be viewed on a direct coupled
oscilloscope, are illustrated in (d) and (e), where
A. M./DEV RANGE: 150 kHz.
amplitude 'B' represents a signal on the right channel
MAX MOD FREQ:= 200 kHz.
due to an input on the left channel.
DE-EMPHASIS : OFF, even if pre-emphasis is
being applied.
Channel 1 separation is given by:
Function: DEV + or DEV -
Separation = 20 log 10 A/B (1)
(4)
Apply a test signal of a chosen frequency to the
where A and B are measurements indicated in
left channel with no signal to the right channel.
(5)
Connect Wave Analyser type TF 2330, or an
An f.m. stereo transmitter or stereo modulator
equivalent instrument for harmonic analysis of
must meet specified requirements as regards response
the audio range, to the OUTPUT terminals of the
and phase shift. In the F. C. C. requirements, it is
modulation meter. (Refer to the instruction
deemed that these are met if the channel separation
manual on the analyser for calibration and
exceeds 29.7 dB.
measuring procedures. )
A suitable oscilloscope, such as a Marconi
(6)
The frequency spectrum of the demodulated
Instruments type TF 2200, connected to the OUTPUT
output of the modulation meter can be obtained
terminals 6f the modulation meter, enables the channel
by tuning through the frequency range and
separation to be measured. Fig. 2-8 shows typical
taking measurements at the appropriate
oscillograms obtained on a TF 2200 Oscilloscope from
frequencies. The result is usually referred to the
which such measurements would be made.
fundamental and expressed as percentages or
dB readings, calculated by the usual method for
From 200 Hz to 1 5kHz. the channel separation
harmonic distortion measurement as described
figure of the modulation meter is typically 13 dB below
in the wave analyser manual.
the minimum required of f.m. stereo channels in the F.
C. C. regulations, while at 50 Hz (the worst condition), it
is at least 3 dB below.
Fig. 2-6. Test arrangement for measuring distortion
2-12
|
|
Privacy Statement - Press Release - Copyright Information. - Contact Us |
